Damao Zhang
Translator
Pacific Northwest National Laboratory

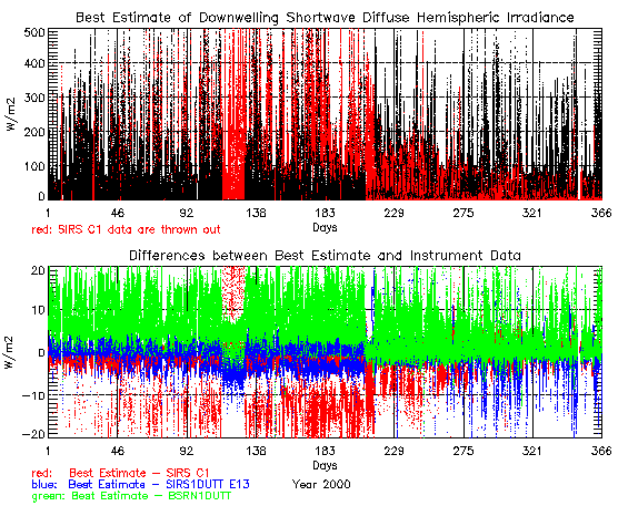
The Best-Estimate Surface Radiative Flux (BEFLUX) VAP processes data from three Southern Great Plains Central Facility radiometer systems when all are available. Before 2001, this VAP used corrected diffuse SW from the DiffCorr1Dutt VAP as input. The 1-minute input data are compared to decide which to use for averaging to get the best estimate. The output data are saved in two NetCDF files containing the best estimate values, QC flags, and the difference fields.
For more details, see Best Estimate Radiation Flux Value-Added Procedure: Algorithm Operational Details and Explanations.

