Hydrometeor Field Spatial Statistics Derived From Radar Scans
Published: 14 November 2024
A new evaluation data set, Plan Position Indicator (PPI) Hydrometeor Field Statistics (PPIHYD), provides spatial statistics based on distinct (clustered) hydrometeor fields from radar scans.
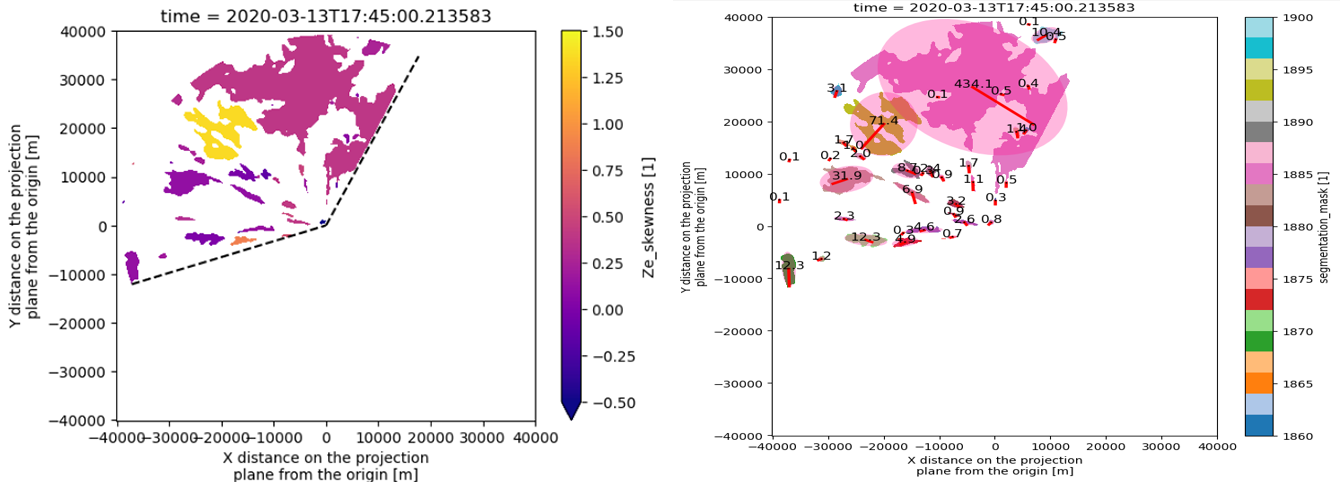
By leveraging information harvested from Atmospheric Radiation Measurement (ARM) user facility scanning radar measurements, statistics such as spatial moments and percentiles are calculated for radar reflectivity and Doppler spectral width on a per-cluster basis. Other per-cluster statistics include the number of reflectivity peaks; estimated water contents and precipitation rates using parameterizations from the literature; and morphological properties of hydrometeor fields, such as area, solidity, and aspect ratio.
Currently applied to Ka-Band Scanning ARM Cloud Radar (KASACR) observations, PPIHYD comprises two daily data products in netCDF format. These products support the analysis of hydrometeor field spatial variability and microphysical properties, and they can be used to evaluate the subgrid-scale representation of clouds and precipitation in large-scale models. The kasacrppihydmask product provides hydrometeor field feature masks generated on a Cartesian grid for each scan and elevation angle. The kasacrppihydfeat product is a low-volume, one-dimensional data set consisting of the hydrometeor field feature statistics derived for each detected feature (cluster).

An initial set of PPIHYD evaluation data is now available for the full KASACR deployment during the Cold-Air Outbreaks in the Marine Boundary Layer Experiment (COMBLE) near Andenes, Norway, from December 1, 2019, through May 31, 2020. A Jupyter Notebook demonstrating the use of PPIHYD to visualize and evaluate KASACR data from COMBLE is available in the ARM-Notebooks GitHub repository.
More information about PPIHYD is available on the product web page.
Access the new data in the ARM Data Center. (To download the data, first create an ARM account.)
For questions or to report data issues, please contact Israel Silber.
The kasacrppihydmask data can be referenced as doi:10.5439/2203040. The kasacrppihydfeat data can be referenced as doi:10.5439/2203039.
Keep up with the Atmospheric Observer
Updates on ARM news, events, and opportunities delivered to your inbox
ARM User Profile
ARM welcomes users from all institutions and nations. A free ARM user account is needed to access ARM data.


